AGRA-COMESA
Regional Food Balance Sheet Initiative
Advisory Committee Progress Update
Phase II Implementation Status For Production Estimation

Outline
AGRA-COMESA Regional Food Balance Sheet Initiative
Advisory Committee Progress Update - Q1/Q2 2025
Progress & Achievements
Current Status: Executive Summary, Key Achievements, Technical Milestones
Monthly Bulletins: Production Specifications, Features & Analysis, Impact Plans
Area Estimation: Methodological Innovation, Results & Data Comparison
Validation & Challenges
Yield Validation: Crop Cuts vs. Model Predictions, Visual Comparison, Critical Gaps
Performance Analysis: Historical Models, Partnership Coordination, Implementation Challenges
Forward Planning: Strategic Recommendations, Q2 Work Plan, Resource Requirements
Summary
Technical Progress
Successfully implemented ensemble machine learning models (XGBoost, CatBoost, LightGBM, Random Forest) across six Phase-1 countries with strong performance for maize in data-rich regions.
Regional Coverage
Active operational models for Kenya, Uganda, Rwanda, Tanzania, Malawi, and Zambia with expansion planned for 1-2 additional countries in Q3 2025 "Ethiopia, and Zimbabwe, other potential-Mozambique and Burundi".
Partnership Engagement
Regular bi-weekly coordination meetings with COMESA and data-focused sessions addressing integration challenges and capacity building needs.
Operational Systems
Enhanced monthly bulletin production with improved visualization techniques and progress toward automated forecasting deployment.
Direct Country Involvement
Limited Country Technical Involvement.
Validation
Weak validation due to the lack of complementary data collection initiative.
Key Achievements & Progress
Technical Milestones
- Enhanced monthly reporting template with comprehensive regional analysis
- Crop-area estimation methodology combining multiple satellite data sources through statistically rigorous sampling framework
- Sample-based cropland area estimation framework applied to seven countries (Kenya, Tanzania, Malawi, Rwanda, Uganda, Zambia) with quantified uncertainties
- Virtual office hours with COMESA commenced for knowledge transfer
- Bean crop models implementation across all active countries based on established maize framework
- Progress toward fully operational automated yield forecasting system
1. Yield Models
Earth Observation + Machine Learning Approach
Core Approach: We Model YIELD Only
Current system focuses exclusively on yield prediction using satellite data and machine learning. Production estimates are calculated separately by multiplying predicted yields with historical area data.
Earth Observation Data Collection
Satellite Inputs: NDVI (vegetation), ESI (water stress), temperature, precipitation, soil moisture
Processing: Statistical features (mean, max, min, percentiles) calculated throughout growing season
Machine Learning Ensemble
Models: XGBoost, CatBoost, LightGBM, Random Forest
Training: Combined cross-country approach OR country-specific models
Yield Prediction Output
Results: Monthly yield forecasts with uncertainty metrics
Performance: Combined model R² = 0.81 (model explains 81% of the variance in crop yields), RMSE = 0.29 (this represents roughly 2-15% error)
Production Calculation
Current Method: Yield × Historical Area Data
Limitation: Uses outdated area estimates, not real-time cropland mapping
Key Limitation: Area Estimation Gap
Production estimates rely on historical FAO area data rather than current satellite-derived cropland area estimates, creating significant uncertainty in total production forecasts.
1. Yield Models
Model Performance & Critical Production Estimation Gaps
Yield Model Strengths
Combined Model: R² = 0.81, MAPE = 11.32%
Regional Success: Excellent performance in Zambia (R² = 0.85)
Cross-Regional Learning: Addresses data gaps through knowledge transfer
Current Limitations
Data Gaps: Substantial heterogeneity in historical yield data across countries
Kenya Challenge: Combined model underperforms (R² = 0.32 vs 0.51 for country-specific)
Training Data Age: Some models trained on data ending in 2015
Critical Gap: Production Estimation Methodology
Current Approach: Production = Predicted Yield × Historical Area Data (FAO/National Statistics)
Problems:
- Historical area data may not reflect current cropland extent
- No integration with real-time satellite-derived area estimates (this would require crop-type masks)
- Significant discrepancies between area data sources (see Area Estimation Framework slides)
- Reduces accuracy of total production forecasts despite good yield predictions
Priority Action: Integrate Area Estimation Framework
Combine the statistically robust sample-based area estimation methodology (detailed in slides 7-9) with yield predictions to create comprehensive, real-time production forecasts that reflect both current yield conditions and actual cropland extent.
2. Monthly Bulletin Production & Specifications
Enhanced Regional Food Security Reporting
Standardized monthly bulletins provide comprehensive agricultural intelligence across all operational countries with improved visualization techniques and decision-support analytics.
Bulletin Specifications
Frequency: Monthly production schedule maintained consistently
Coverage: All 6 phase 1 countries (Kenya, Uganda, Rwanda, Tanzania, Malawi, Zambia)
Crops: Maize, rice, and beans with seasonal forecasting
Technical Enhancements
Visualizations: Multi-layered maps, trend analysis, and regional comparisons
Analytics: Ensemble model outputs with confidence intervals
Integration: Intention is for RFBS platform compatibility and automated data integration
Key Bulletin Features & Analysis
Comprehensive Regional Analysis
Content: Yield forecasts, production estimates, seasonal outlooks, and food security indicators across multiple agroecological zones.
Methodology: Transparent documentation of model performance, uncertainty quantification, and data quality assessments.
High Decision Support Potential
Policy Integration: Bulletins designed to inform agricultural planning cycles and emergency response mechanisms.
Stakeholder Engagement: Regular dissemination to COMESA technical teams, national partners, and regional food security networks.
Monthly Bulletin Future Plans
Current Performance Metrics
Monthly bulletins demonstrate consistent delivery and comprehensive coverage across all operational countries with measurable impact on stakeholder decision-making processes.
Q1 2025 Performance
Planned Q2 2025 Improvements
- Integration of crop cut validation results into bulletin accuracy assessments
- Enhanced county/district-level reporting for high-priority regions
- Automated bulletin generation pipeline testing and deployment
Critical Gaps
- Integration of crop cut validation results into bulletin accuracy assessments
- Expanded stakeholder feedback collection and bulletin utility assessment
Quality Assurance
Validation: Ground-truth data integration from field observations
Accuracy: Continuous model performance monitoring and calibration
Feedback: Stakeholder input collection and response implementation
Future Enhancements
Automation: Streamlined production workflow development
Granularity: Sub-national reporting capabilities expansion
Integration: Enhanced platform connectivity and data sharing
3. Cropland Area Estimation Framework
Methodological Innovation
Statistical Robustness
Developed a statistically robust framework addressing biases in direct pixel-counting methods from satellite maps. Combines systematic map accuracy evaluation with sample-based area estimation to provide reliable cropland area figures with quantified uncertainties.
Two-Component Approach
1. Map Accuracy Evaluation
Method: Stratified random sampling to assess performance of six global/regional land cover maps (DEA, DynamicWorld, ESRI-LULC, Copernicus, GLAD, GLC FCS30D)
Key Finding: No single map performs consistently well across all regions
2. Sample-Based Area Estimation
Method: Optimized stratified sampling to minimize standard error, with manual annotation by multiple independent analysts using high-resolution imagery
Target: Coefficient of variation of 10% for cropland area estimates
Cropland Area Estimation Framework
Results: Country-Specific Area Estimates (2019)
📊 Area estimates by country
Comparative visualization showing area estimates across all countries
Implementation Status
Current Limitation: While this framework represents a path toward more accurate area estimation, current production forecasts for RFBS still rely on established FAO datasets. This methodology provides the foundation for future improved agricultural monitoring.
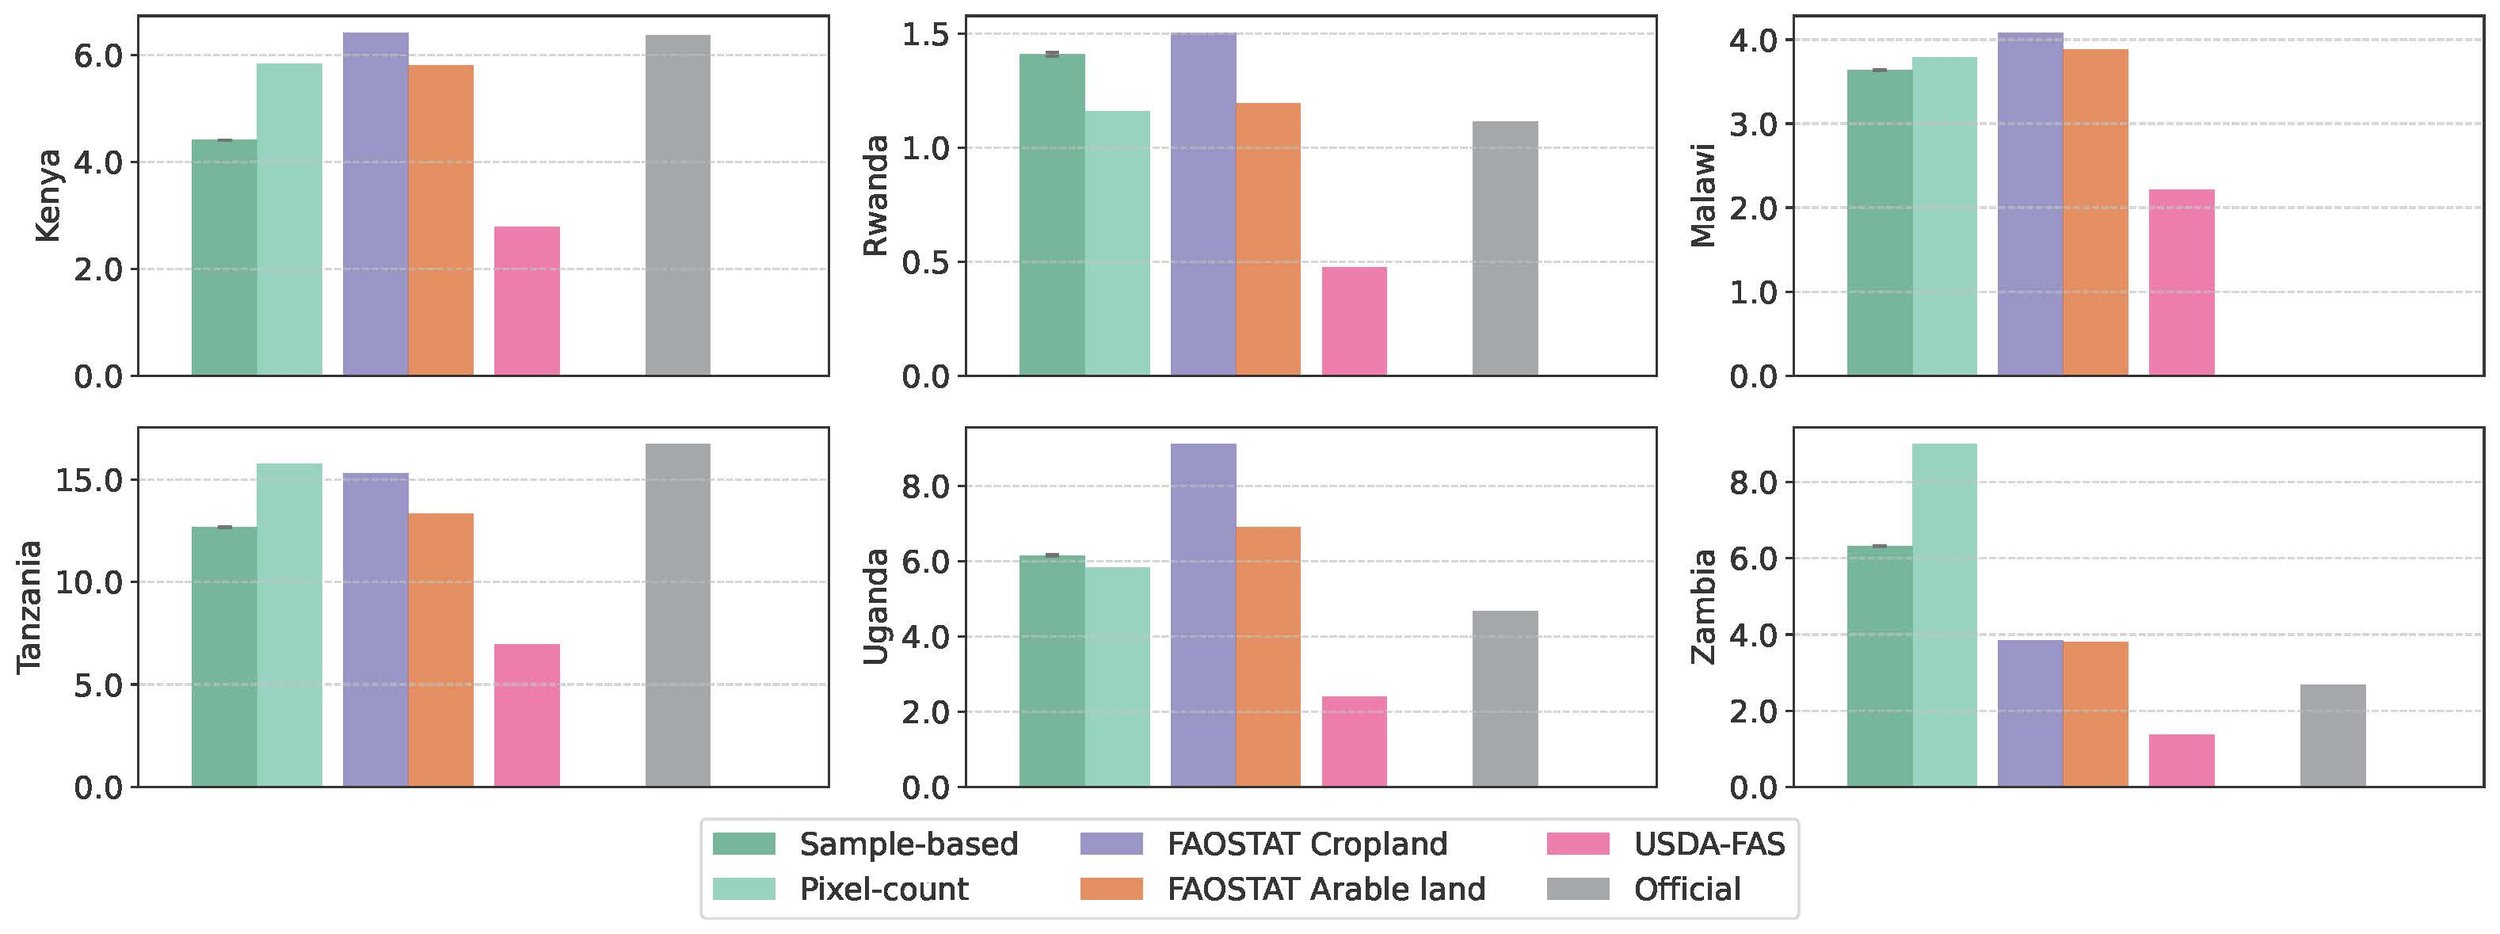
Cropland Area Data Source Comparison
2019 Cropland Area Estimates from Multiple Sources (Million Hectares)
| Country | FAOSTAT Cropland | FAOSTAT Arable | USDA FAS | Official Report | Sample-based | Mapped Area |
|---|---|---|---|---|---|---|
| Kenya | 6.41 | 5.8 | 2.78 | 6.36 | 4.4±0.43 | 5.83 |
| Rwanda | 1.5 | 1.19 | 0.47 | 1.11 | 1.41±0.15 | 1.16 |
| Malawi | 4.08 | 3.88 | 2.22 | N/A | 3.63±0.29 | 3.78 |
| Tanzania | 15.31 | 13.32 | 6.96 | 16.72 | 12.66±1.61 | 15.75 |
| Uganda | 9.1 | 6.9 | 2.39 | 4.66 | 6.14±0.76 | 5.83 |
| Zambia | 3.84 | 3.8 | 1.37 | 2.67 | 6.31±0.93 | 8.99 |
Key Findings
Significant Discrepancies: Substantial variations between data sources highlight fundamental differences in cropland definitions and measurement approaches.
USDA FAS Lower Values: Consistently lower because they represent annual harvested area of major commodity crops only.
Validation Results
Strong Correlation: Sample-based estimates show R² = 0.805 (NRMSE = 18.5%) with country reports and R² = 0.794 (NRMSE = 15.3%) with FAOSTAT Arable land data.
Methodological Importance: Demonstrates need for transparent, statistically robust approaches.
4. Yield Validation: Crop Cuts vs. Model Predictions
Preliminary Crop Cut Validation Study (Kenya Maize)
Ground Truth Collection: First systematic crop cut validation campaign reveals significant discrepancies between model predictions and field measurements.
County-Level Crop Cut Yields vs. Model Predictions
Top Performing Counties (Crop Cuts)
- Kakamega: 11.3 tons/ha
- Trans Nzoia: 7.2 tons/ha
- Bungoma: 5.9 tons/ha
- Nakuru: 5.9 tons/ha
- Narok: 4.7 tons/ha
- Uasin Gishu: 3.9 tons/ha
Current Model Predictions (Kenya Maize 2025)
- USDA Model: 2.1 tons/ha
- UMD Model: 2.5 tons/ha
- Median: 2.3 tons/ha
Yield Validation: Visual Data Comparison
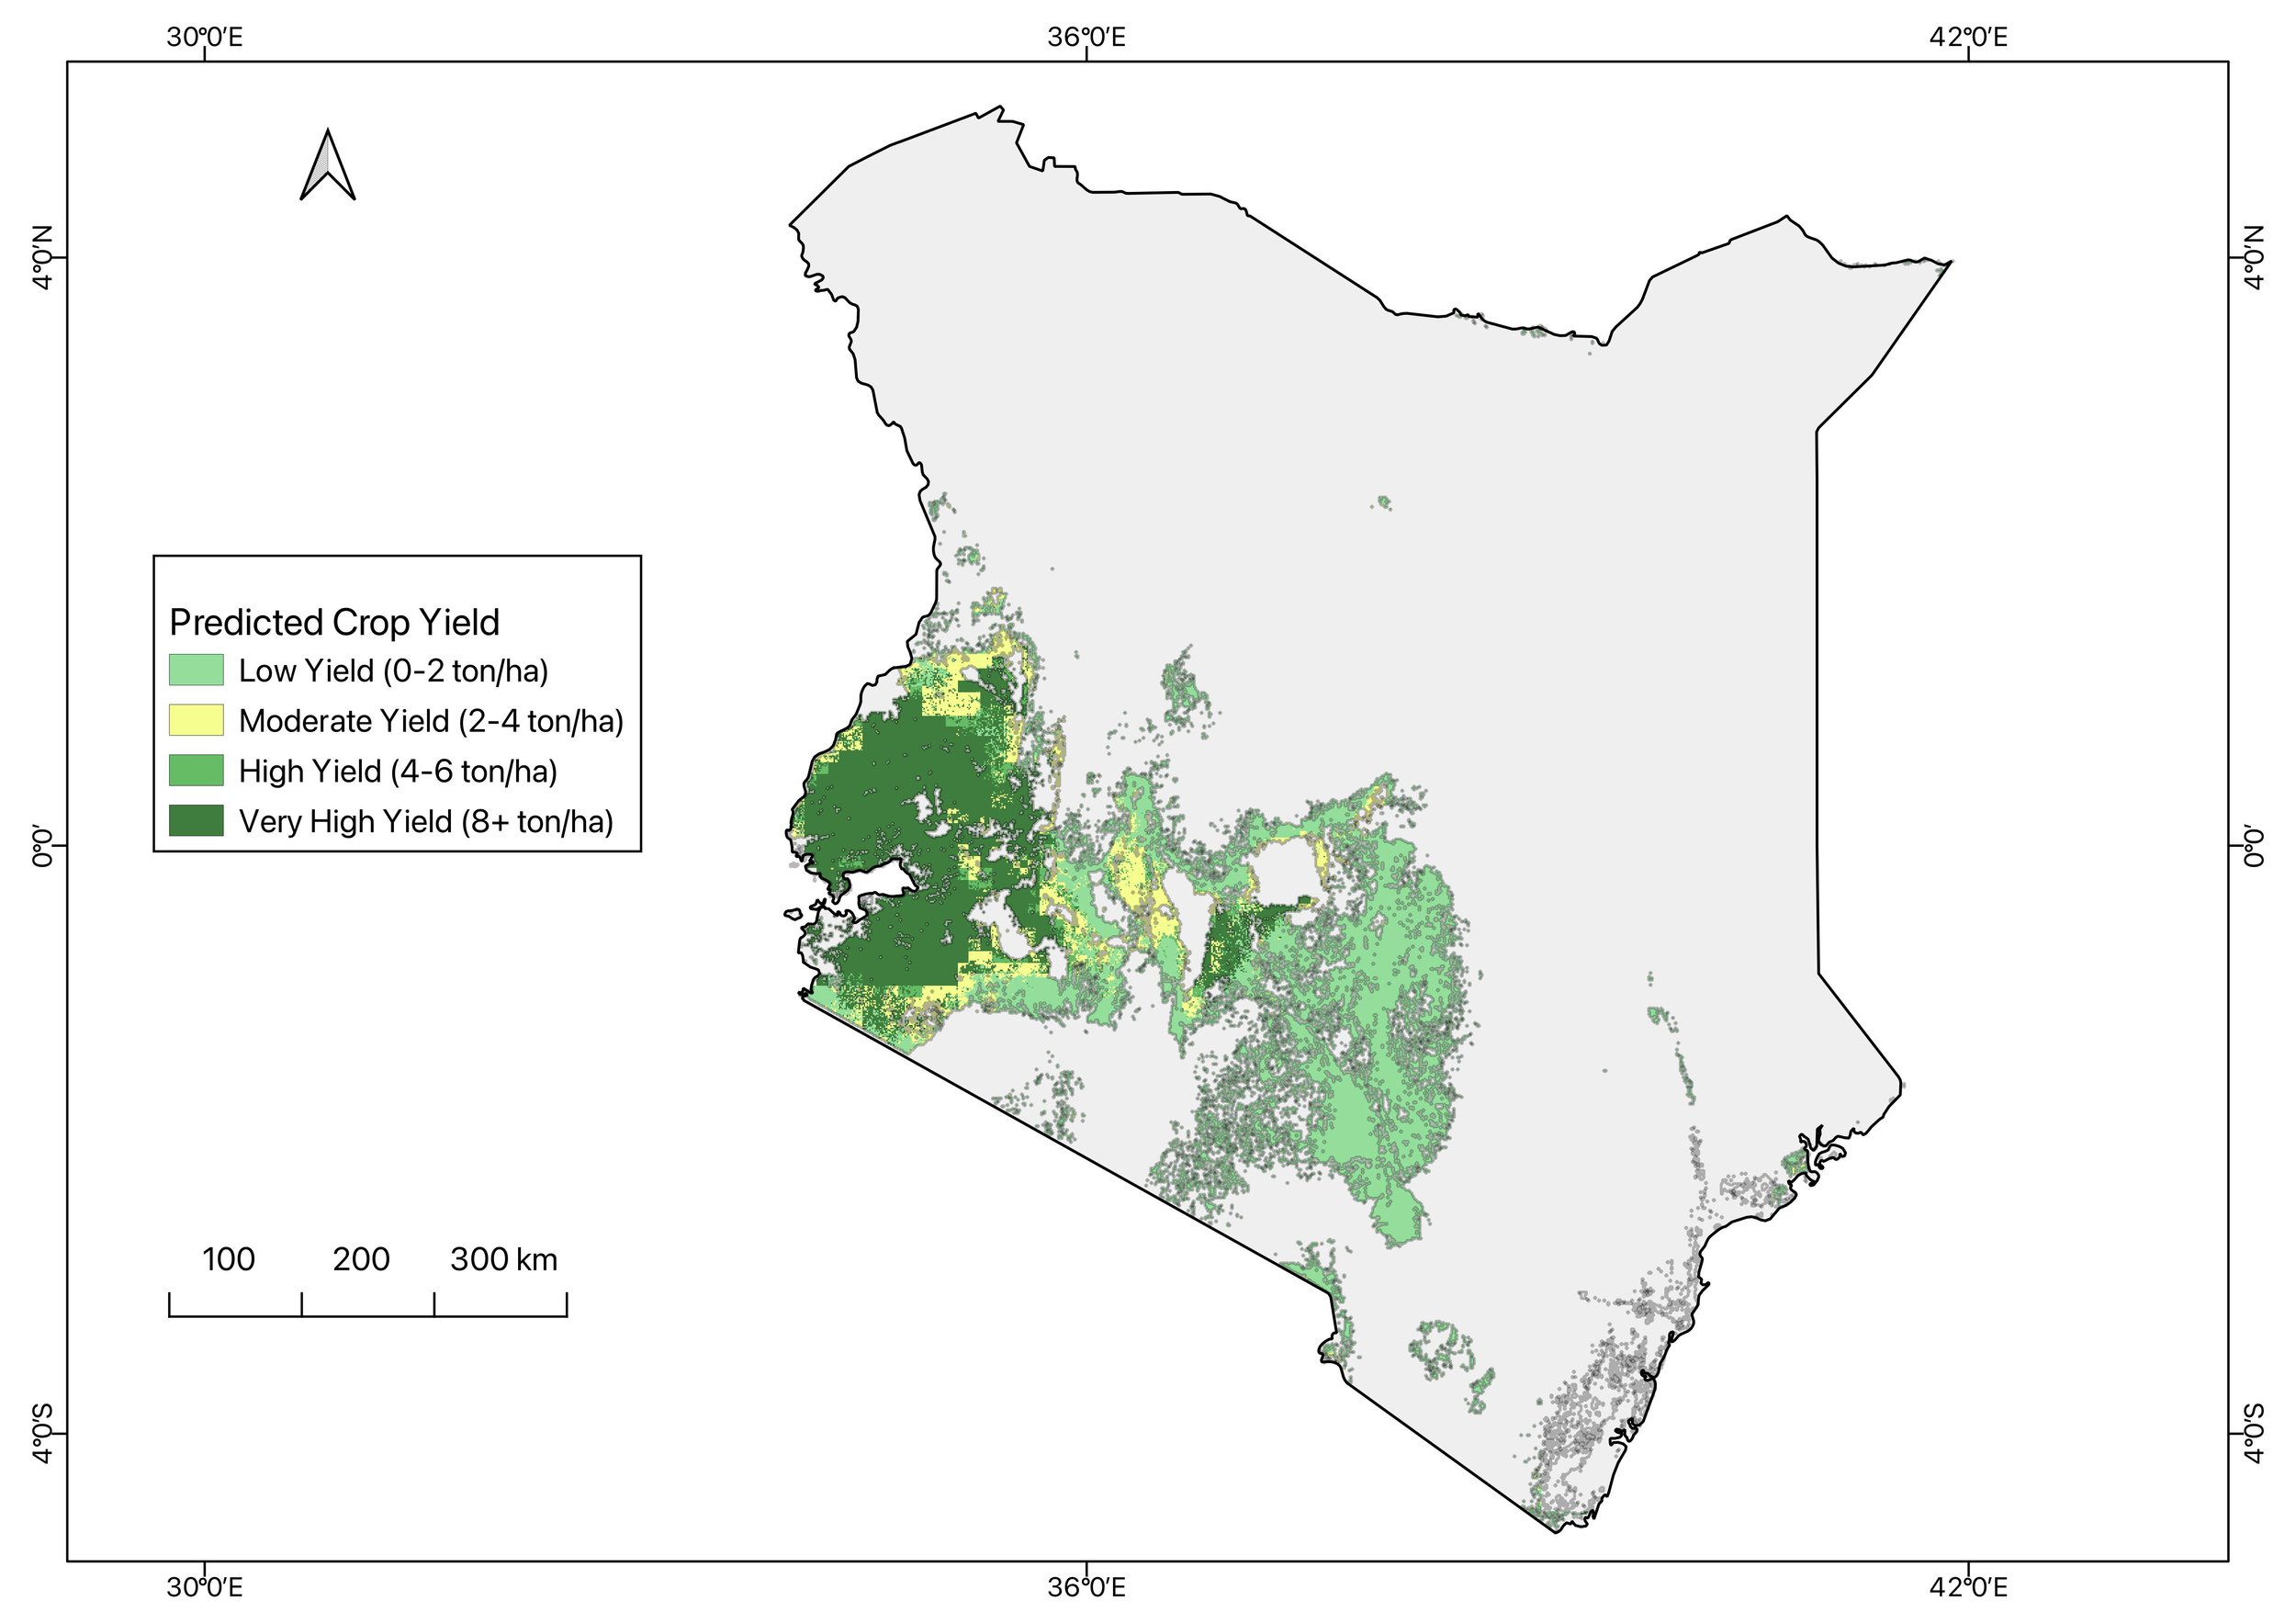
Yield distribution Modeled from crop-cuts data (ECAAS project 2023 Data)
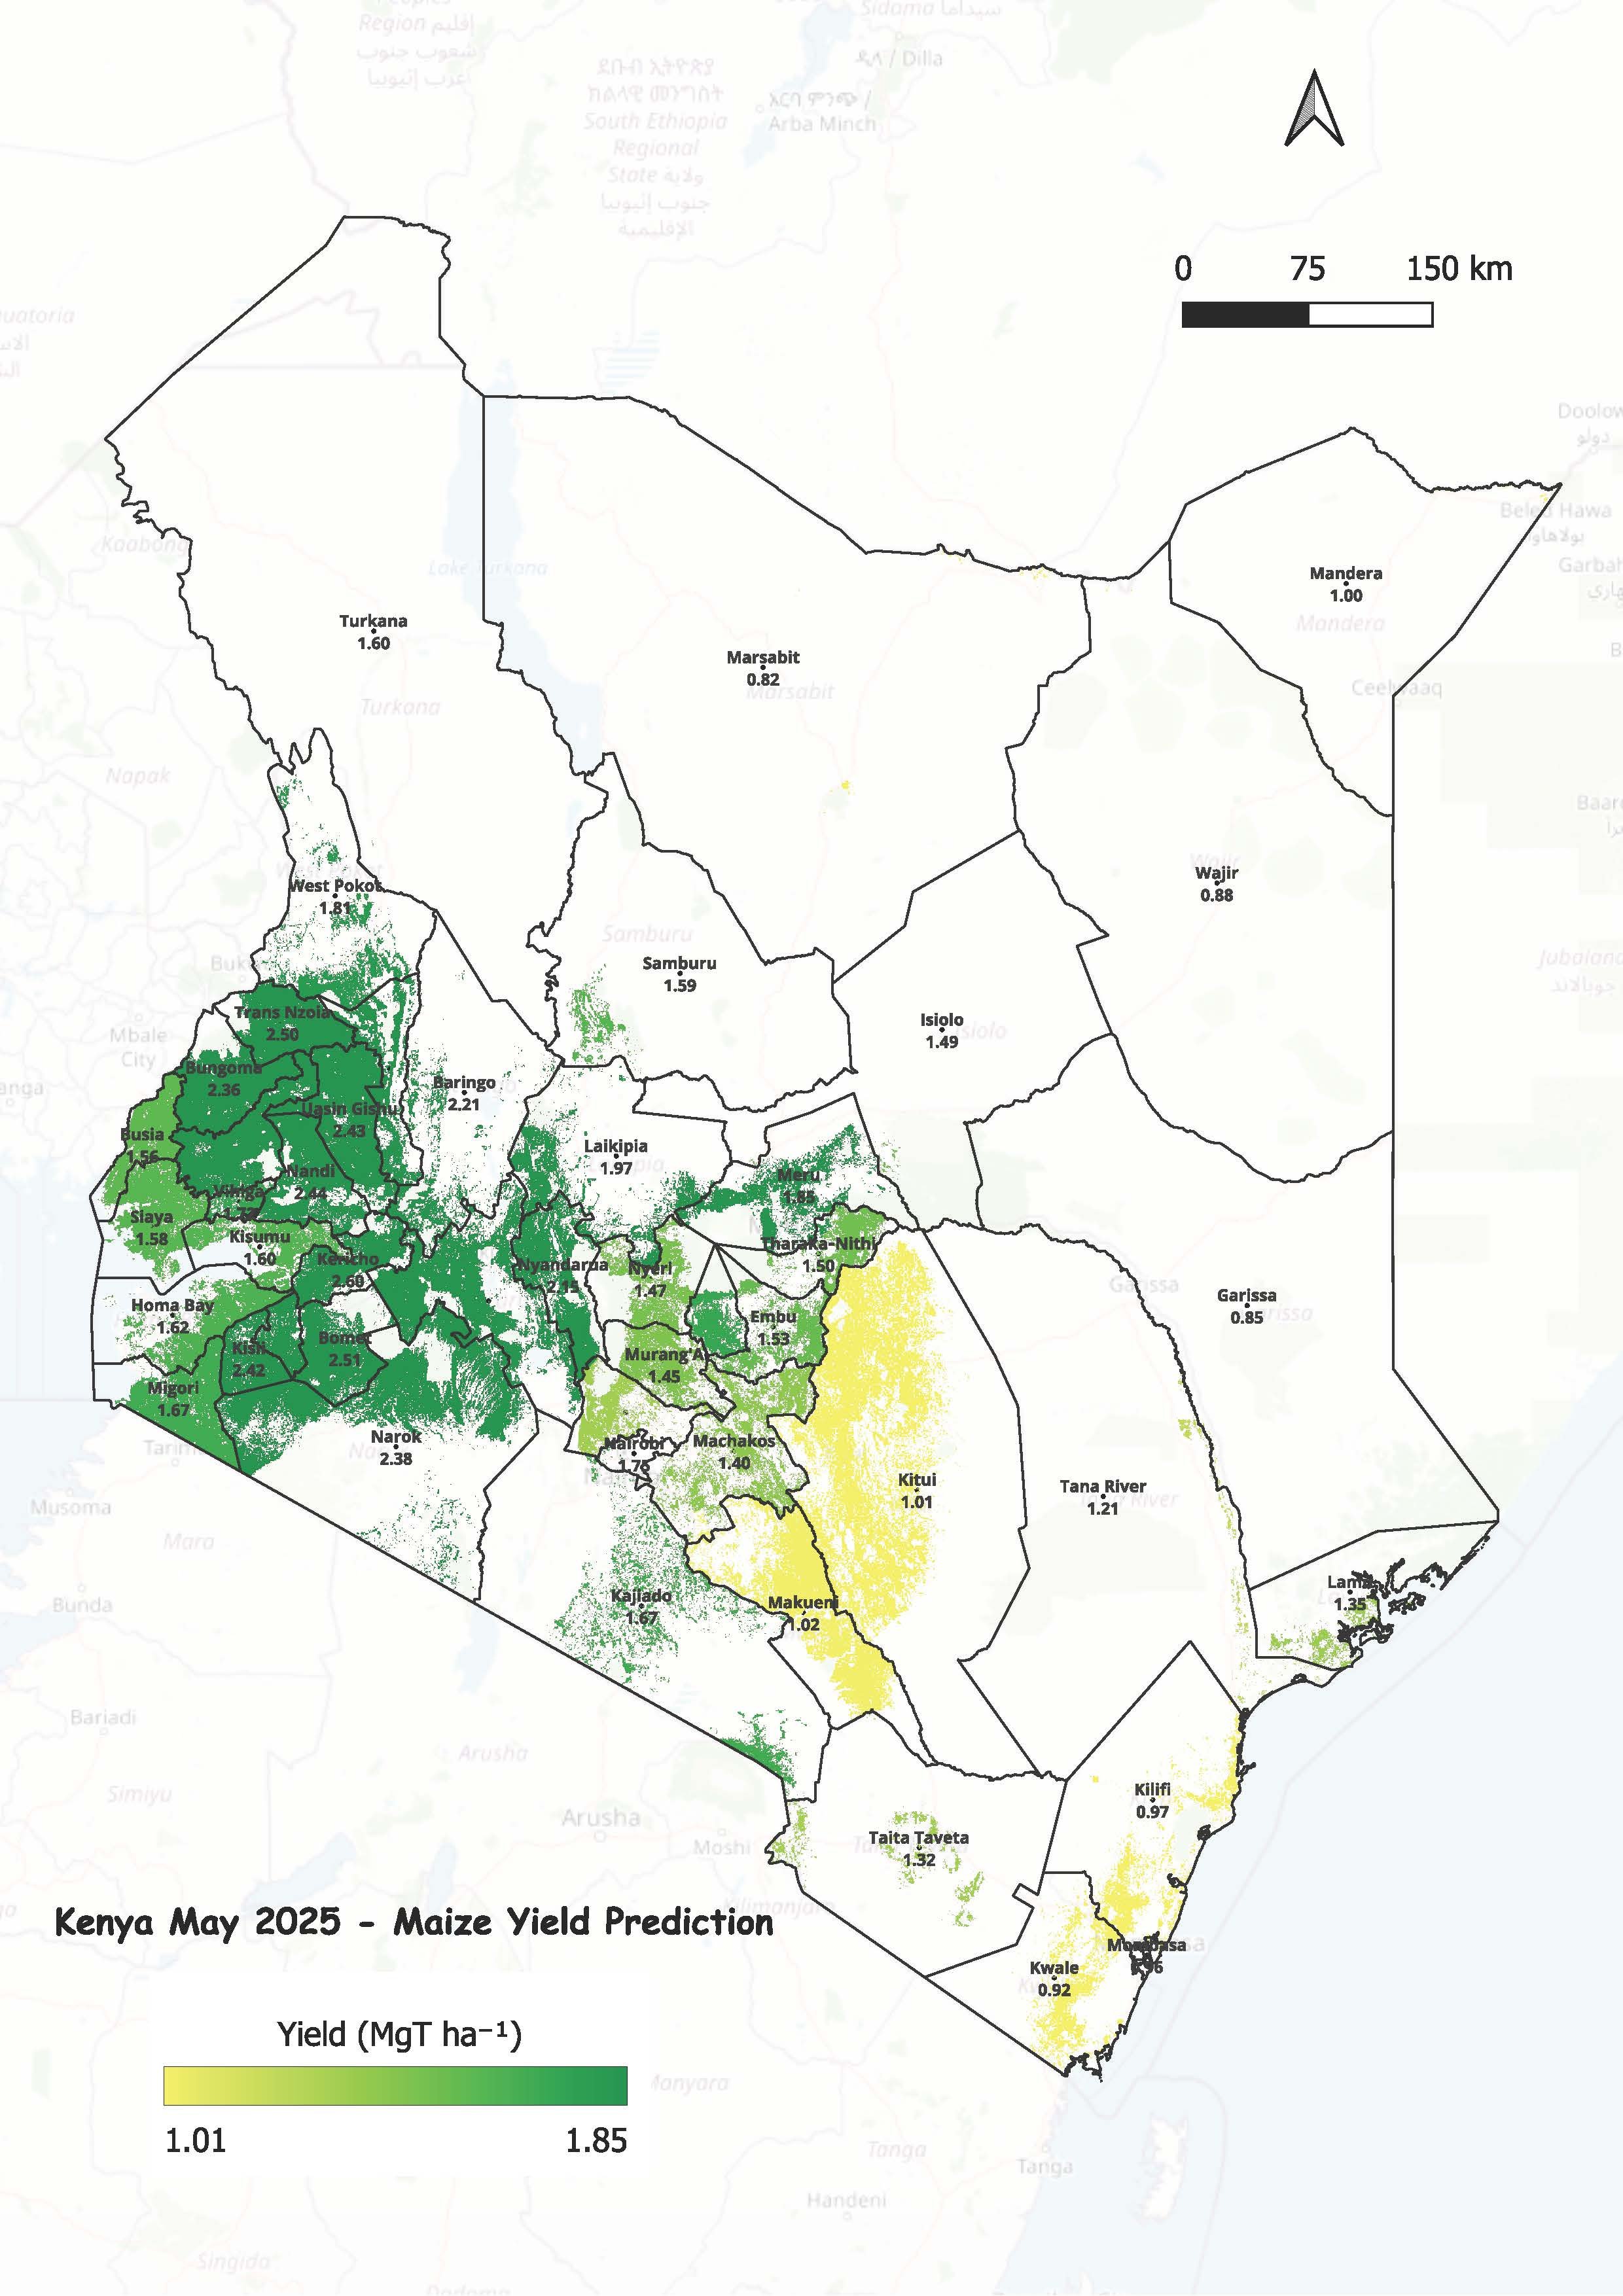
2025 Prediction based on historical yield
Yield Validation: Critical Gaps & Action Plan
Critical Validation Gaps Remain
Significant Underestimation: Models predict 2.1-2.5 tons/ha while crop cuts show yields ranging from 0.2 to 11.3 tons/ha in high-producing counties.
Regional Variation: County-level yields vary by over 50x, highlighting need for spatially explicit validation approaches.
Self-Reported vs. Measured Yields
Example Discrepancies: Kakamega shows 19.7 tons/ha self-reported vs. 11.3 tons/ha measured; Trans Nzoia shows 26.1 tons/ha self-reported vs. 7.2 tons/ha measured.
Data Quality Issues: Confirms challenges with farmer-reported yield data used in model training.
Immediate Validation Priority Actions
- Expand crop cut validation to all operational countries and additional crops
- Integrate crop cut data into model retraining and calibration processes
- Develop county/district-level yield prediction capabilities
- Establish systematic ground truth data collection protocols
Historical Model Performance Analysis
Kenya Maize Yield Model Training History
Analysis of historical model performance reveals training data limitations and temporal trends that contribute to current prediction gaps.
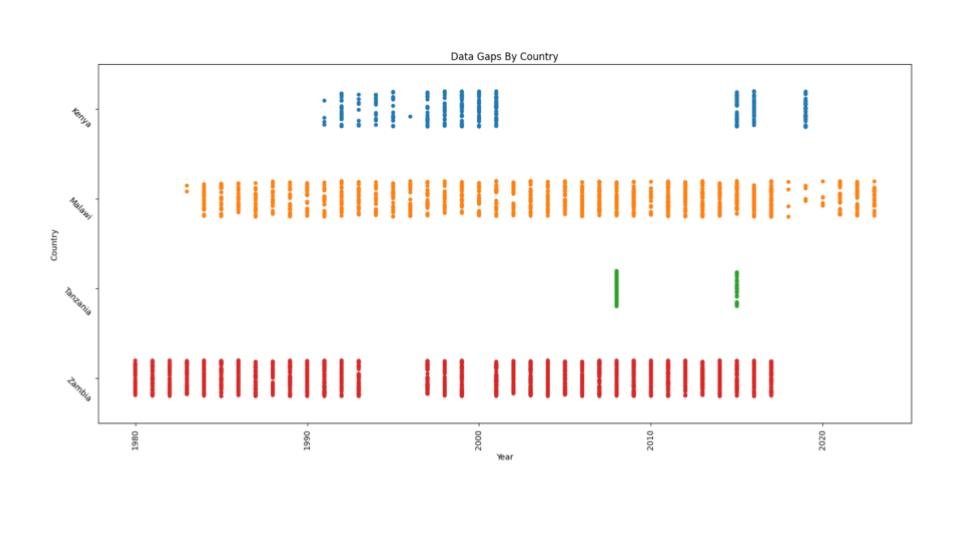
📊 Historical model training availability
Training Data Limitations
Historical Coverage: Model trained on data ending in 2015, creating a 10-year gap between training and current predictions.
Yield Trends: Potential yield improvements and agricultural intensification not captured in training data.
Temporal Validation Gaps
Data Staleness: Models may not reflect recent agricultural practices, varieties, or climate adaptations.
Model Drift: Performance degradation over time due to changing agricultural landscape.
Model Updating Requirements
- Incorporate recent crop cut validation data into model retraining
- Update training datasets with post-2015 yield observations
- Implement ongoing model performance monitoring and calibration
- Develop procedures for regular model updates aligned with agricultural seasons
5. Other Updates
Partnership Coordination
RFBS Phase 2 Partners Bi-Weekly Progress Update
AGRA Data-Focused Meeting: Discussion of data needs, coordination with AGRA partners, and data integration approaches for model refinement
AGRA Data-Focused Meeting: Review of data quality issues across countries and strategic planning for addressing performance gaps
Data Ingestion Technical Session: Focus on data pipeline optimization and system integration challenges for automated forecasting
AGRF Session Proposal Selected and session concept In-Preparation
5. Other Updates
Critical Implementation Challenges
Poor Training Data Quality
Issue: Historical data availability and quality varies significantly across target countries, requiring continuous adaptations to modeling approaches and alternative data source development.
Impact: Compromises model accuracy and reliability, particularly in data-sparse regions like Tanzania and Malawi.
Insufficient Validation Efforts
Issue: Lack of complementary ground truth data in many areas complicates validation efforts for area estimates, forcing development of alternative validation approaches.
Impact: Reduces confidence in model outputs and limits ability to assess accuracy across different agroecological zones.
Limited Capacity Building Resources
Issue: Resource constraints for comprehensive regional analysis and infrastructure scaling are increasing, while dedicated capacity building programs remain under-resourced.
Impact: Hampers sustainable knowledge transfer and long-term institutional strengthening.
Weak National Representative Engagement
Issue: Need for stronger coordination and more frequent engagement with national agricultural ministries and statistical agencies beyond current bi-weekly updates.
Impact: Limits local ownership, data access, and alignment with national agricultural policy planning cycles.
5. Other Updates
Actions/Recommendations
Immediate/In-progress Actions (Q2-3 2025)
- Prediction presentation (adopting range presentation)
- Establish dedicated data quality assessment protocols with standardized validation metrics
- Implementing targeted feature re-engineering for underperforming regions
- Develop country-specific technical engagement strategies for national agricultural ministries
Medium-term Initiatives (Q3-Q4 2025)
- Invest in regional capacity (Leveraging AGRF event)
- Establish systematic accuracy evaluation framework as part of standard workflow
Long-term Strategic Goals
- Adopt sample-based area estimation approaches for national and regional monitoring
- Develop country-specific crop-type maps accounting for regional agricultural practices
- Build sustainable technical capacity within COMESA and national institutions
- Integrate RFBS and bulletin outputs into national agricultural policy planning cycles
5. Other Updates
Q2-3 2025 Work Plan
5. Other Updates
Resource Requirements & Support Needs
Partner Coordination
Need: Enhanced facilitation of data access from national partners and coordination support for new country integration
Impact: Essential for geographic expansion and data quality improvement
Technical Infrastructure
Need: Infrastructure scaling to handle increasing data processing requirements for comprehensive regional analysis
Impact: Critical for maintaining system performance as coverage expands
Capacity Building
Need: Dedicated resources for systematic training programs and knowledge transfer activities
Impact: Fundamental for sustainable long-term implementation
Validation Framework
Need: Investment in ground truth data collection and alternative validation methodologies
Impact: Essential for improving model confidence and accuracy assessment
Preparation AGRF 2025 Engagement
Session approved for a dedicated session at 2025 AGRF to showcase progress, address challenges, and strengthen stakeholder engagement across the region.
5. Other Updates
Key Performance Indicators
Track R² and RMSE values for newly added countries and crops with continuous improvement targets
Monitor user engagement metrics from COMESA technical team and national partners
Quantify knowledge transfer through pre/post assessments of technical skills among regional staff
Document instances where dashboard and/or bulletin data informs policy or operational decisions
Adaptive Management Approach
Recognition that agricultural forecasting involves inherent uncertainties, particularly in regions with variable data quality. Our approach emphasizes transparency in methodology, continuous improvement through iterative refinement, and clear communication of confidence levels with all stakeholders.
Review Schedule: Monthly reviews with implementation partners and updates as needed to address emerging priorities or challenges.